UCB Rain Water Sampling Results
Back to Main UCB Air and Water Sampling Page
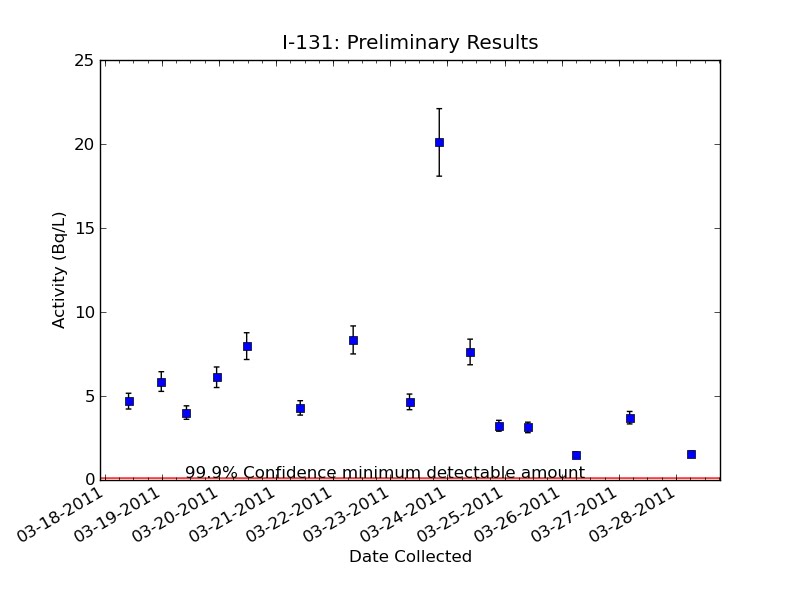
The following are results for rain water samples taken on the roof of Etcheverry Hall on UC Berkeley campus beginning on 3/17/2011. In the table below the plots, we are providing two numbers for each of the isotopes. The first is a standard concentration unit of Becquerel per liter (Bq/L) which describes the number of particles decaying over the period of one second. For the general public, we have converted this number to an exposure dose per liter consumed. The number in parentheses is the number of liters of water that one would need to consume to equal the radiation exposure of a single round trip flight from San Francisco to Washington D.C. (0.05 mSv). For more information on how this equivalent dose is calculated, the details are here: How Effective Dose is Calculated For example, in the rain water we collected in 18 hours between March 17 and March 18 we observe an activity of the isotope of I-131 (Iodine-131) of 4.26 Bq/l. At this level, you would need to drink 632 liters of this rain water to obtain the same radiation effects you obtain on a round-trip flight between San Francisco and Washington D.C. Therefore, the increase in radiation levels in the rain water due to the events in Japan remain extremely small. We will continue to monitor radiation levels in air and water in the foreseeable future and will provide the measured radiation levels here. As of 3/23/11 14:00, these numbers have been revised to account for the half-lives of the various isotopes measured. This leads to a slight increase in the previously reported numbers. Details can be found at this link: Description of Activity Correction for Isotope Half-life. Now the Minimum Detectable Activity (MDA) is plotted as a blue line on these plots. The MDA represents the lowest level of measurement where we can confidently report results. To find out more about how the MDA is calculated, please visit How we calculate MDA. Description of Rainwater Collection Experiment


Nenhum comentário:
Postar um comentário